Contour Lines: They're Not Just for Geography Nerds
If you've ever looked at a navigational map, such as Ordnance Survey (OS) or Harvey, you'll almost certainly have noticed that they contain many squiggly lines - these are contour lines, and they are there to show you the shape of the land. They are an essential part of navigation, especially in mountainous terrain, but how exactly do you read them?
What are Contours?
[Source]
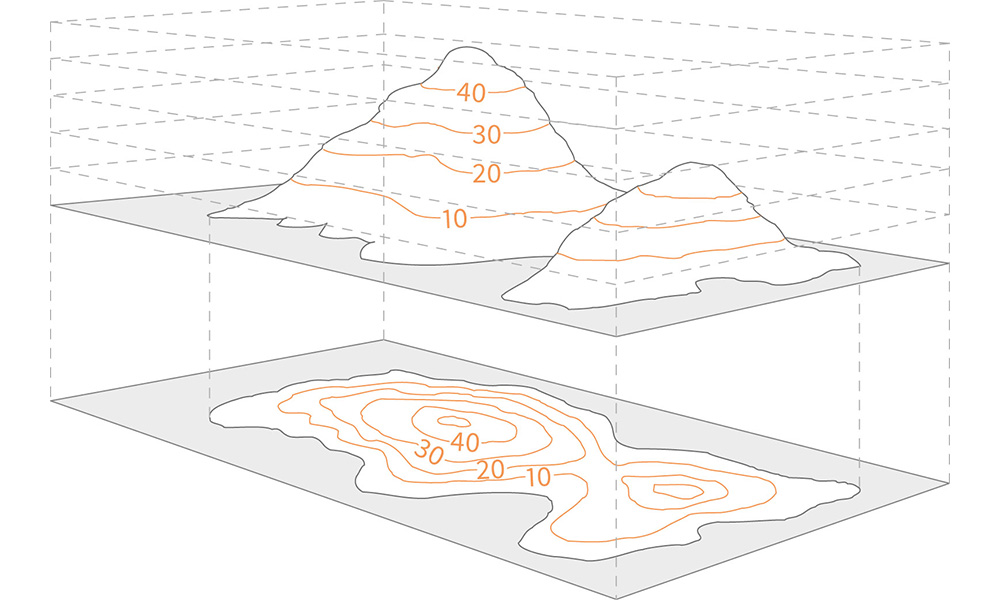
Contour lines connect points of the same elevation allowing a flat map to describe the shape and features of the land, such as hills, valleys and ridges. This means that if you follow a contour line around a hill, you'll stay at the same height the whole way around.
To read them, you also need to understand the contour interval - this is the vertical distance between each contour line and is usually printed on the map legend. OS maps, for example, generally use a contour interval of 5 metres meaning that each contour line represents a difference in elevation of 5 metres. OS maps also show every fifth line slightly thicker to aid with counting contour lines. The closer the contour lines are together, the steeper the slope. If the contour lines are far apart, the slope is more gentle.
Top tip: On Harvey maps the colour of the contour line changes to grey in areas of rocky terrain.
[Source]
[Source]
Contour lines can accurately show the steepness and gradient of a slope, but not its direction. To determine the direction of a slope some contour lines are marked with their elevation, these are known as index contour lines.
Contour Interpretations
Visualising contour lines can be tricky at first, but with practice you'll soon get the hang of it. To develop this skill, it is important to understand how different slopes are represented by contours.
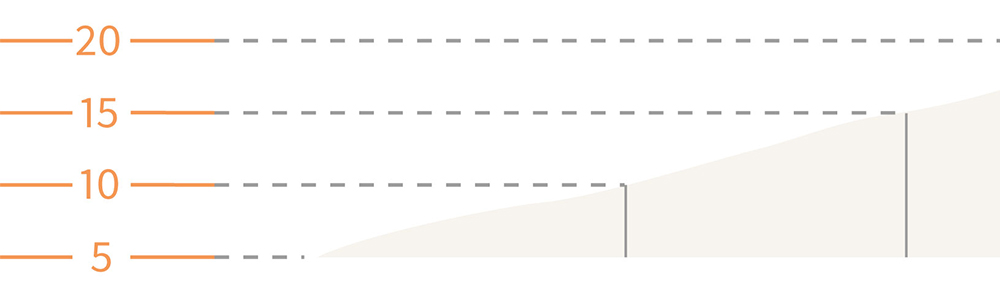
- Uniform slopes have a constant steepness, meaning that the elevation changes the same amount over a given distance. On a map, they are represented by evenly spaced contour lines.
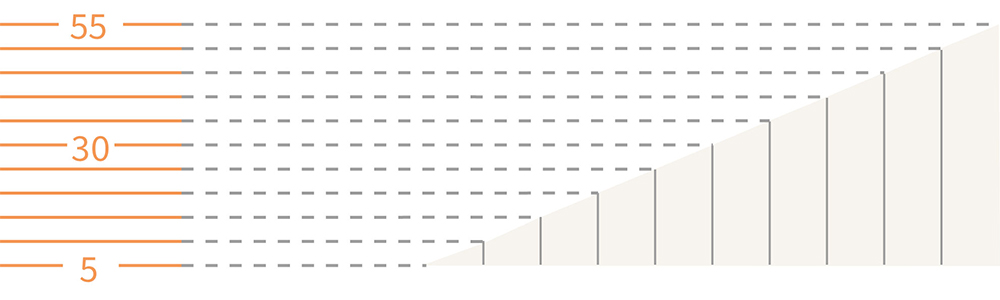
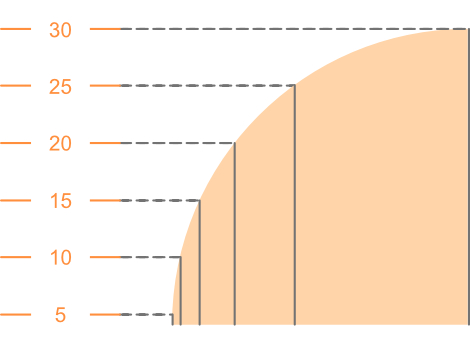
- Convex slopes are curved slopes that bulge outward. On a map, they are represented by contour lines that are spaced closer together at the base (lower elevations) and become further apart as you climb.
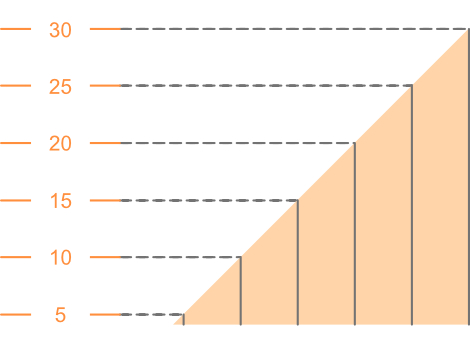
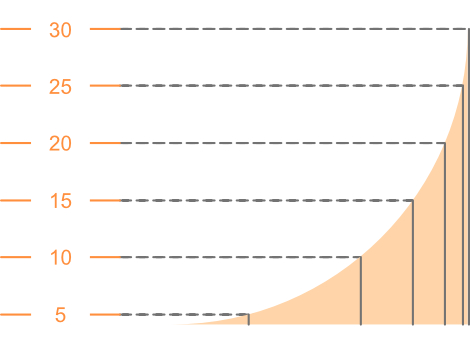
- Concave slopes are curved slopes that curve inward. On a map, they are represented by contour lines that are spaced further apart at the base (lower elevations) and become closer together as you climb.
Composite slopes
In reality, most slopes are a combination of convex, concave, and uniform sections. These are known as composite slopes. For example, a hill may have a concave slope at the bottom, a uniform slope in the middle, and a convex slope at the top.
Additional Considerations
Once you have got the hang of visualising various slopes, the following additional considerations will help you master your skills:
Ring Contours
Ring contours are closed contours that form a continuous loop, with no other rings inside them. They play a crucial role in identifying prominent landforms like hills and depressions. When you encounter a ring contour, it indicates either the summit of a hill or the base of a dip. The width of the ring provides further insights. A wide ring suggests a large, flat area at the top of a hill or the bottom of a depression.
Use Personal Experience and Knowledge
Your own experience and knowledge of the landscape can significantly enhance your ability to interpret contour lines. If you are familiar with the area, you can use your understanding of the topography (shape of the land) to guide your interpretation. For example, if you know you are on a ridge, you can anticipate that the contour lines will be spaced further apart on the top of the ridge and closer together on the sides.
Understanding What's Not Represented: The Gaps Between Contours
It's equally important to understand what's not represented on a map as it is to understand what is. Contour lines provide elevation information at specific intervals, typically 5 or 10 metres. This means that the actual elevation between contour lines can vary within the interval. For instance, with a 10-metre interval, the elevation between contour lines could range from 0 to 9.9 metres. Recognising this gap is essential for accurately interpreting the terrain.
Representing Vertical Slopes
Another example of terrain that contour lines are not designed to accurately represent are extremely steep slopes, like cliffs. In these cases, the contour lines would overlap or stack on top of each other, making them impossible to read. To address this limitation, maps often use symbols, such as cliff symbols, to indicate sheer edges or vertical slopes.
#GoForIt
So, there you have it, a crash course in understanding contour lines (and nothing about geography 😅). Once you've mastered the basics, you'll be able to navigate the world with a newfound appreciation for the subtle language of the land. Just remember, contour lines are like the lines on a person's face – they reveal a lot about their character. And with a little practice, you'll be able to read them like an expert.
Now #GoForIt, go forth and conquer the hills, valleys, and mountains – armed with your trusty map and your newfound knowledge of contour lines. Happy exploring!